Recently Blog Entries
- Why Your Kanban Workflow Should Be More Than “In Progress”
- Two Questions to Help You Understand if You’re Doing Kanban
- Spike Abuse
- My Latest Article on Agile and Security
- Essentials of the Scaled Agile Framework
- A Possible Solution to the Issue of Test Data
- Project Sauron: A Long-lived, Stealthy and Likely State-sponsored Malware
- CCTV cameras used in massive botnet
- Sprint Planning: The Case for Finishing What You Start
- Scrum Retrospectives: Start, Stop… Continue? One of these things is not like the others…
Subscribe

Categories
Polls
 Loading ...
Archives
- May 2017
- April 2017
- September 2016
- August 2016
- June 2016
- May 2016
- April 2016
- March 2016
- February 2016
- January 2016
- December 2015
- October 2015
- September 2015
- July 2014
- January 2014
- March 2013
- February 2013
- January 2013
- December 2012
- July 2012
- May 2012
- April 2012
- January 2012
- November 2011
- October 2011
- September 2011
- August 2011
- April 2011
- October 2010
- August 2010
- July 2010
- June 2010
- May 2010
- March 2010
- February 2010
- January 2010
- December 2009
- November 2009
- October 2009
- September 2009
- August 2009
- July 2009
- June 2009
- May 2009
- April 2009
- March 2009
- February 2009
- December 2008
- November 2008
- September 2008
- July 2008
- June 2008
- May 2008
- April 2008
- March 2008
- February 2008
- January 2008
Admin
Search
Feb
6
Fundamentals of UML Modeling: Behavioral Diagrams
Posted by Keith McMillan
February 6, 2008 | Leave a Comment
The Unified Modeling Language is primarily used for describing the design of software systems, although it can be used for other purposes as well, such as business process modeling. This is the second in a series of posts covering the fundamentals of the UML, it talks about UML behavioral diagrams. The previous post covered requirements diagrams, and a subsequent post will cover UML structural diagrams. Dynamic diagrams describe the behavior of a system, the interactions that it performs in the course of doing work.
Unaccountable Bias Towards Structure
For some reason I’ve never really understood, many folks who document components or systems focus exclusively on structural diagrams rather than behavioral diagrams. I’ve seen countless software library packages whose documentation contains class diagrams and package diagrams showing the structure of the system, what I describe as “what the system looks like standing still” but no interaction diagrams at all. I take the opposite approach: if I had to chose between the two, I’d rather have behavioral diagrams than structural ones.
With procedural programming, understanding how a program ran was pretty easy: you started at “main” and you read until you got to the end. You might have functions to look at, but in general, all the logic was there, in a flow from start to end. With object-oriented programming, the logic is scattered around through all the classes. In a large system, there can be thousands of classes. This means that in order to understand the sequence of events, you need to look in far more places in an object-oriented system.
Before anyone gets the idea that I miss procedural programming, that’s not really the case. I’m quite happy that object-oriented programming is around. It’s a great technique for decomposing complicated problems into more manageable chunks, and it allows us to design closer to the problem domain. But I do think it distributes the logic into more places.
Consider a software library used to create Adobe Acrobat files. I had the task recently of trying to figure out how to use such a package as part of a project recently. The library came with documentation for all the classes provided: each class had neat descriptions of what the class did, and the other classes of which it was a descendant. It also came with structural diagrams (class diagrams), which I could have done without, because I could have figured out the inheritance easily enough from the written documentation of the classes.
Unfortunately, what I most wanted to know was how to use the library. In order to know how to use it, I needed an entry point: the classes which the author intended I should use in order to make the whole thing work. In other words, where were the controllers, and what was the expected interaction with them? Who called who, if you will. This could have been neatly answered with a UML sequence diagram showing me the typical interaction: “How to Create a Document and Add Sections”, for instance. Instead I was left to guess at likely packages and classes, and reading the documentation for each to see if it did what I needed, then trying to figure out if it was supposed to be called from some other class, rather than directly.
Written-word documentation for a class library is essential, as it gives you all the detailed description of behaviors, but in order to get that overview of how all the parts work together, you need a behavioral diagram to show you the lay of the land. Without them, it’s like trying to figure out how to drive from Massachusetts to California by reading descriptions of the counties in each state, and seeing if you can figure out where the freeways line up. A behavioral diagram in this analogy is a national highway system map, with it you can see the states you’re going to pass through.
Types of Behavioral Diagrams
UML defines a number of behavioral diagrams:
- Activity Diagram
- State Diagram
- Interaction Diagram, of which there are subtypes:
- Sequence Diagram
- Interaction Overview Diagram
- Communication Diagram
- Timing Diagram
I’m only going to focus on the most commonly used diagrams here: the sequence, activity, and state diagrams, you don’t see the others that often.
Sequence Diagrams
Sequence diagrams, as the name implies, show a sequence of messages or invocations of methods passing from one object to another. They are organized with objects, subsystems and actors along the top of the diagram, with a vertical line called a “lifeline” extending vertically down from them. Individual messages or invocations of methods are shown as a line going from one lifeline to the next, with either the message or the method name shown above the line. This indicates one object communicating with another, and the arrow indicates the direction of the communication. The example sequence diagram below shows a hypothetical use case of browsing an online catalog.
Sequence diagrams are the most common type of behavioral diagram. In fact, I’ve worked on systems where they were the only type of behavioral diagram created. They neatly demonstrate how objects interact in order to perform some function. UML 2.0 syntax includes tools to allow you to reference other diagrams for whole/part type diagrams, to indicate alternative choices, and to indicate looping, which is a great improvement over earlier versions.
Activity Diagrams
Activity diagrams are like flow charts, except they add additional capabilities. Of particular interest is the ability to add synchronization bars in an activity diagram. Synchronization bars allow you to indicate that parallel flows start at some point, or that one or more parallel flows must both complete before moving on to the next step. The activity diagram below shows what happens when you take your car in for service. The auto shop performs a number of activities, and they can proceed in parallel, but before you can check out and pay, they all have to be completed.
Activity diagrams are handy for documenting processes, particularly interactions where multi-threading is important.
State Charts
State charts are a classic tool covered in most CS curricula, they’re used to describe states in a state machine, and their valid transitions. A handy thing to have, particularly when you have state involved in your entity objects, but nothing earth shattering here. The attached sample statechart shows the states of a product release.
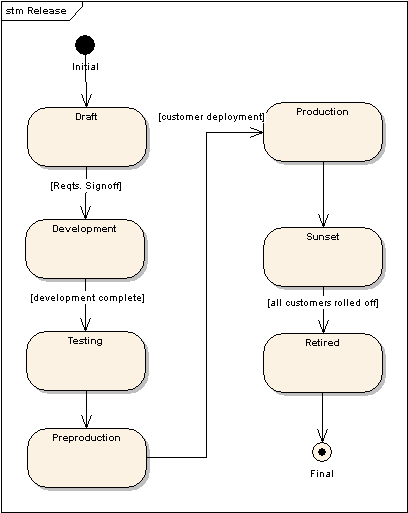
These three behavioral diagrams, sequence, statechart and activity diagrams, are the typical ones found in a UML model. UML provides for other behavioral diagrams, as I outlined earlier, but they’re less frequently used.
Next time, we’re going to look at structural diagrams in UML.
Comments
Comments »
Blogroll
- Ars Technica
- Dark Reading - IT Security
- Help Net Security
- InformIT
- SANS Internet Storm Center
- Schneier on Security - Dr. Bruce Schieier’s blog
- Security Info Watch
- What to Fix - Daniel Markham, fellow consultant
- Wired Gadget Lab
- Wordpress Documentation
- WordPress Planet
- Wordpress Support Forum
No comments yet.